Customizing a Grafana Dashboard
For each flow, you can view flow metrics in a Grafana dashboard. This tutorial describes how you complete the following tasks for each flow:
| • | Customizing Data - Add your own metrics to the flow to meet your organization's needs. |
| • | Setting Up the Grafana Dashboard - Edit the Grafana dashboard for the flow so that it meets your organization's requirements. |
| • | Setting Up Alerts - Set up alerts that will be sent when certain conditions within the flow are met. |
You can view the Grafana dashboard for a flow from the Developer Console > Flow admin menu > "View metrics" option.
The following screenshot shows a default Grafana dashboard for a flow.
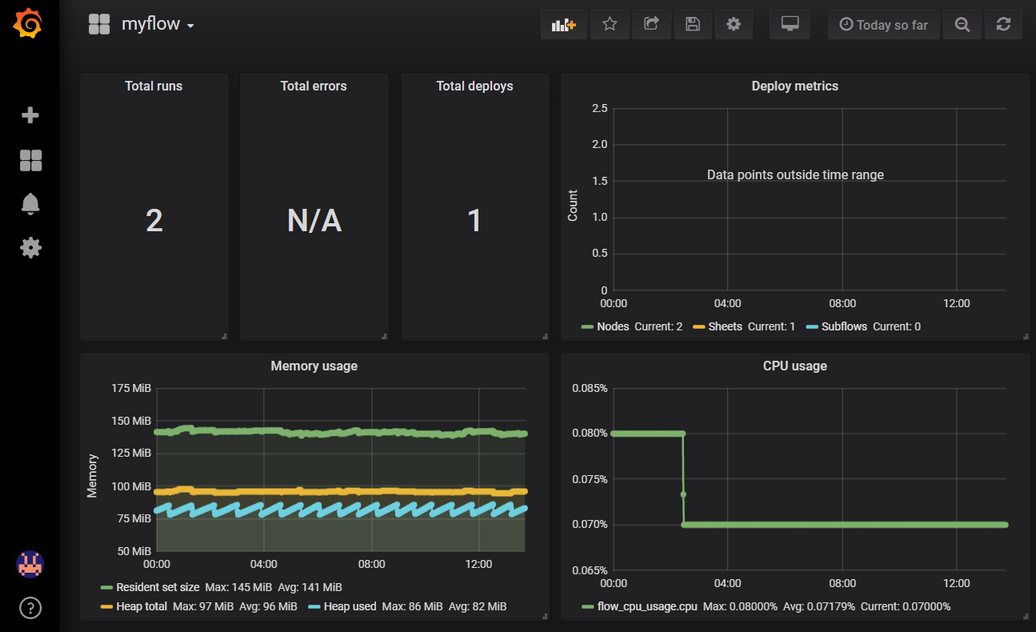
Note that you need to add customized data (described here) to the flow before continuing with this tutorial.
You can add custom metrics to the dashboard (and send it to InfluxDB) in two ways:
| • | Add a custom metric node to the flow. |
| • | Add a function node to the flow. |
You need to set up just one of these nodes before continuing with the tutorial. The following procedures describe how to use a custom node and a function node to achieve the same result.
To add custom metrics using the custom metric node:
| 1. | In the Flow Editor, add a custom metric node to the flow. |
| 2. | Double-click the custom metric node to open the Edit node pane. |
| 3. | Add the following code (or similar) to the Metric field: |
metric = { measurement: 'monitored-value', fields: {numberField: msg.value, } }; |
where:
|
| 4. | Click the Done button to save the code. |
| 5. | Click the Deploy button to deploy the edited flow. Ensure you use this flow in the following steps. |
To add custom metrics using the function node:
| 1. | In the Flow Editor, add a function node to the flow. |
| 2. | Double-click the function node to open the Edit node pane. |
| 3. | Add the following code (or similar) to the Function field: |
const RED = require('node-red'); const value = Math.round(Math.ransom() * 100); RED.util.insertMetric({ measurement: 'monitored-value', fields: { numberField: value, } }); return msg; |
where:
|
| 4. | Click the Done button to save the code. |
| 5. | Click the Deploy button to deploy the edited flow. Ensure you use this flow in the following steps. |
Setting up the Grafana Dashboard
By default, flows are set up to report on a set of runtime metrics. The data is sent to an Influx database (InfluxDB). If you are the flow owner, you can view the metrics via the Grafana dashboard, and add customized graphs and tables if required.
To add a graph to a Grafana dashboard:
| 1. | Open the Grafana dashboard from the Developer Console > Flow admin menu > "View metrics" option. |
| 2. | Click the Add panel |
| 3. | Click the title of the new graph and select "Edit" from the drop-down menu. |
| 4. | From the Data Source drop-down menu, select the flow ID for the flow (you can find this number on the Developer Console, under the flow name). |
| 5. | Set up the query to look like the following screenshot: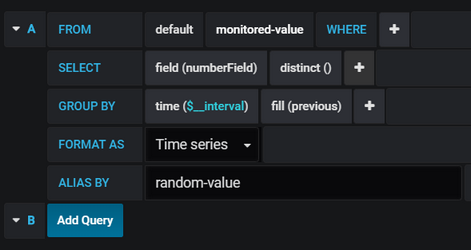 |
Once the query is set up, you should start to see data on the graph.
There are many other options available when setting up queries on the Grafana dashboard. See Grafana Basic Concepts documentation for more information.
To learn more about InfluxDB, see Influx Query Language.
You can set up alerts to send notifications when certain conditions are met within the flow. Note that the Grafana instance does not currently support email notifications. See Grafana Alert Notifications for information on other types of alert notifications that can be set up, but be aware that some of them may not work depending on how they need to be configured.
Ensure you complete the following procedures in the order shown.
Setting Up a Slack Notification Channel
| 1. | From the Grafana dashboard, click the Alerting |
| 2. | Click the New Channel button. |
| 3. | From the Type field drop-down menu, select "Slack". |
| 4. | Complete the fields so that the form looks like the following screenshot: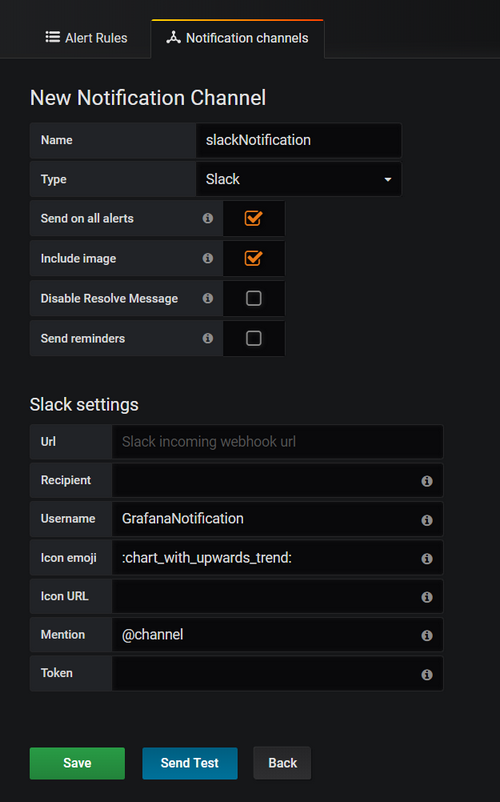 If you have not yet set up a Slack webhook for the Url field, see the following webpage for guidance: Incoming Webhooks. |
| 5. | Click Save to save the channel, or click Send Test to send a test message to the Slack channel. |
Setting Up Alerts
In the following example, we set up an alert to check every minute to see if the max value over the previous minute exceeded 60. If the max value exceeded 60 for more than a minute duration (as set by the "1m" value in the OF field), the alert is triggered. In this case, we would rather receive a late alert notification than be alerted for a false positive (that is, if the data spikes briefly above the max value threshold we do not want to be notified).
| 1. | From the Grafana dashboard click the title of the graph you created in the Setting Up a Grafana Dashboard section, and select "Edit" from the drop-down menu. |
| 2. | Select the Alert tab > Alert Config tab. |
| 3. | Click the Create Alert button. |
| 4. | Complete the fields so that the form looks like the following screenshot: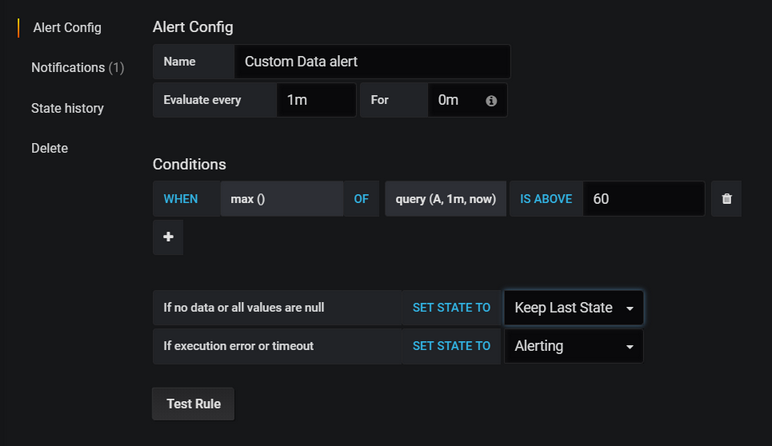 |
| 5. | Select the Notifications tab. |
| 6. | Complete the fields so that it resembles the following screenshot, substituting in your Grafana dashboard URL: 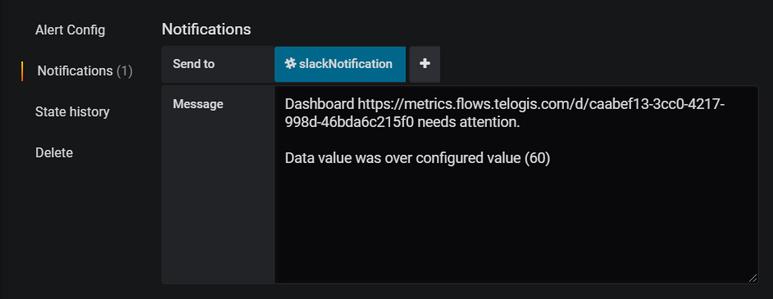 Note that if there are any other alert notification channels set up, these will also be displayed on blue badges in the Send to field. When the value reported by the flow exceeds 60 for more than one minute, an "Alerting" notification is posted to the Slack channel. When the value reported by the flow drops below 60, an "OK" message is posted to the Slack channel: 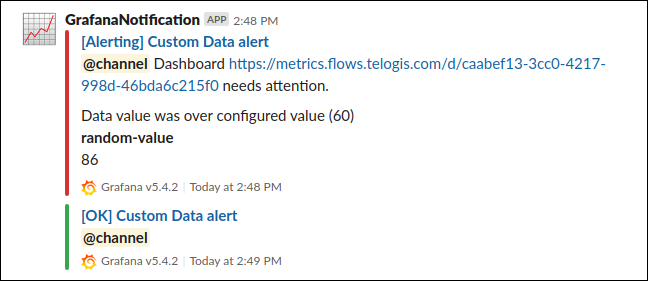 |
 Previous
 Next
Next Print
Print