Verizon Connect Flows includes an integrated node.js inspector and debugger that can be used to step through and inspect functions in your flows as they are developed. You can either choose to debug your code using this integrated UI accessible from the Flow Editor, or use the simple debugging client utility provided in the shell terminal.
Running the UI Debugger
To debug your function using the integrated Verizon Connect Flows debugger UI:
1.
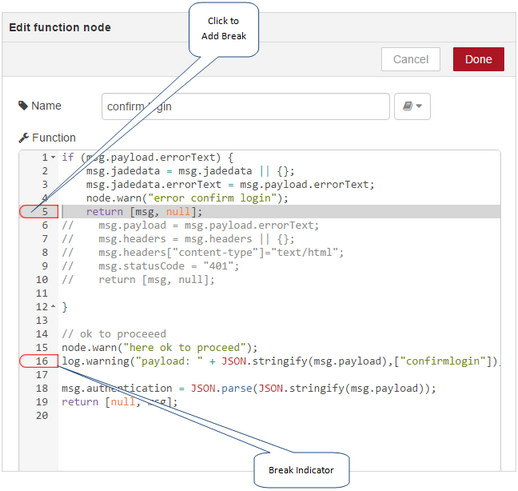
Open the Function node in the Flow Editor by double-clicking it on the palette.
2.
Set a breakpoint or breakpoints in the function node by clicking to the left of a line number in the left column. A red rectangle appears around the number, indicating a breakpoint has been set. To remove the breakpoint, click the line number again to remove the red rectangle.
The function node must be deployed at least once before you can debug it.
3.
Click Done. The Node Editor closes.
4.
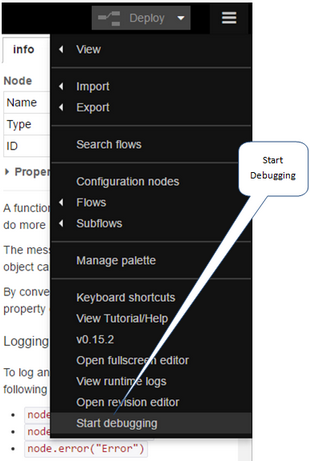
From the menu, select "Start debugging". The top bar of theFlow Editor turns red, indicating you are now in debug mode.
5.
Open the menu once again, and select "Open debugger". A new tab or window opens, and contains the Node Inspector debugging interface. This may take a moment to open and, depending on your browser, you may be asked to give permission for the screen to display notifications.
6.
Launch the flow. The breakpoint is caught once the Function node is reached, and a pause notification is shown in the upper right corner of the browser. Return to the Node Inspector debugger interface to step through the code. From the debugger window you can navigate through your source files, set breakpoints, inspect elements, and perform a range of other debugging activities. For more information about working with the Node Inspector, see the project’s page in GitHub.
To temporarily disable a breakpoint, set _debug = false in the Console window.
7.
When you are done debugging, stop debug mode in the Flow Editor by selecting ≡Menu > "Stop debugging". The top bar of theFlow Editor turns black, indicating that you have exited debug mode.
You cannot edit the flow in the Flow Editor while it remains in debugging mode.
Running the SSH Debugger
To debug your function using the SSH debugger:
1.
Open the Function node in the Flow Editor by double-clicking it on the palette.
2.
Set a breakpoint or breakpoints in the function node by clicking to the left of a line number in the left column. A red rectangle appears around the number, indicating a breakpoint has been set. To remove the breakpoint, click the line number again.
3.
Click Done. The Node Editor closes.
4.
From the menu, select "Start debugging". The top bar of theFlow Editor turns red, indicating you are now in debug mode. .
5.
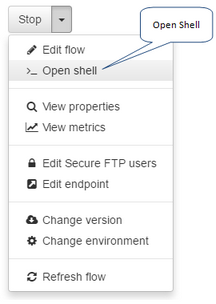
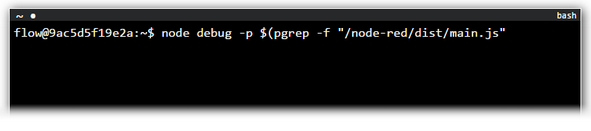
Return to the Administrator screen and open a terminal for the flow, then run the following command to attach the debugger to the process: node debug -p $(pgrep -f “/node-red/dist/main.js”.
6.
Once the debugger is attached, when the flow is run and a breakpoint is hit, the debugger pauses at the breakpoint and outline where the debugger is paused. From here, you can use several commands, including:
o
cont or c - Continue execution.
o
next or n - Go to the next instruction.
o
step or s - Step into the current operation.
o
out or o - Step out of the current operation.
o
repl - Get a REPL (Read Eval Print Loop) where you can inspect variables visible at the breakpoint.
To temporarily disable the set breakpoint, use repl and set _debug = false.
For more information about working with the shell debugger, including additional commands you can run, see the Node.js Debugger documentation.
7.
When you are done debugging, to close the console type exit and execute, or press the Ctrl or Shift key and click the tilde (~) in the upper left corner of the console. Exit debug mode by returning to the Flow Editor for the flow and selecting ≡Menu > "Stop debugging". The top bar of theFlow Editor turns black, indicating that you have exited debug mode.

 Previous
 Next
Next Print
Print